Now that a solution was selected, the project team needed to shift their attention to the cost justification of the system. Upon discussion with the finance department, they learned that my company looks for investments that produce a positive return within a 5 year time horizon. They were asked to provide standard baselines using Time Value of Money (TVM) and Economic Value Added (EVA) to be calculated at 15% for 3 years, 10% over 5 years, and 5% for 10 years. The finance department gave them the following criteria to use in their calculations:
- Depreciate the asset in equal amounts over 3 years.
- Calculate income tax at 50%.
- Using the new system will generate an additional $100,000 in sales in the first year and an increase in sales of 10% per year thereafter.
- Maintenance costs will start at 10% of purchase price and increase by 5% per year.
The time value of money (TVM) is the “process of comparing present cash outlays to future expected returns” (CBU, 2006). By calculating the present value of future returns, an organization is able to compare the returns against the initial outlays to determine if the investment generates positive value.
First the team needed to determine the present worth (PW) of the projected cash flows. “PW brings the respective values of those cash flows back in time to the origin or start point of the investment” (Walker, 1999). PW calculations are applied to After Tax Cash Flows (ATCF). In order to calculate the ATCF the team subtracted the cost of maintaining the system (CMS) from the before tax cash flows (BTCF), subtracted the depreciation over three years (DEP), applied a taxable income rate of 50% (TI) to arrive at the total.

Figure 1—After Tax Cash Flows of Opportunity Management System over 10 years.
Once the after tax cash flows were calculated, they calculated the present value of the cash flows using the criteria set by the finance department:

Figure 2—Present value of 3 year cash flows.

Figure 3—Present value of 5 year cash flows.

Figure 4—Present value of 10 year cash flows.
Upon initial examination, the TVM calculations looked favorable, with a present worth cash flow value of over $85,000 during the target 5 year time horizon. Next, they proceeded to calculating the EVA.
Calculating Economic Value Added
Economic value added is a performance metric that calculates the “profits that remain after the costs of a company’s capital—both debt and equity—are deducted from the operating profit” (McClure, 2003). The formula was developed by Stern Steward in the early 1990’s and is used to “establish the value of organizations and for setting bonus levels for executive management” (Walker, 1999). EVA is calculated as follows:

Figure 5—Formula for calculating EVA (Stewart, 2006)
EVA is the default measurement used by my company to make investment decisions. An investment must generate positive EVA within 5 years, or the investment is not considered. In order to calculate EVA the team must first determine the cost of capital. According to Tully (1996), shareholders have received on average a return that is six percentage points higher on stocks than on long-term government bonds. The current long-term rate on government bonds is just over 4% (Bloomburg, 2006). Therefore, the team used 10% in their EVA calculations order to align with the 5 year target time and used the same TVM percentages to determine the EVA present value.
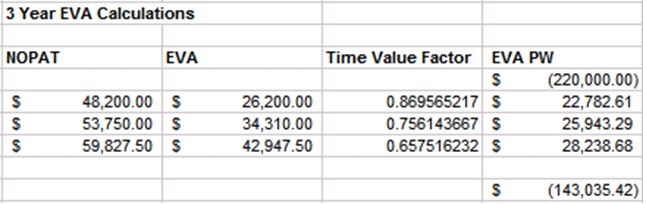
Figure 6—Present value of 3 year EVA.

Figure 7—Present value of 5 year EVA.

Figure 8—Present value of 10 year EVA.
Understanding the Results of TVM and EVA
Upon completing the calculations, the team realized that the EVA generated a result of ($46,000) for the target 5 year time horizon. They were surprised that there was such a significant difference between the TVM and EVA calculations. They compared the 5 year TVM and EVA calculations to try to understand why the EVA generated less favorable results.

Figure 9—Comparison of ATCF and EVA calculations.
Upon discussing with finance they learned that the EVA calculations factored the actual cost of using capital, and as a result, provided a more realistic assessment of the potential investment. The impact on capital was represented through the difference in the ATCF and EVA numbers. And by using the same percentage to calculate the TVM they were able to see an accurate total of projected cash flows over the 5 year period. Clearly this project was not financially justified from an EVA perspective.
My company uses EVA as their primary measurement for evaluating investment decisions. “EVA uses a single financial measure that links all decision making with a common focus: How do we improve EVA? EVA is the only financial management system that provides a common language for employees across all operating and staff functions and allows all management decisions to be modeled, monitored, communicated and compensated in a single and consistent way - always in terms of the value added to shareholder investment” (Stewart, 2006).
Next Steps
As a result of their findings the project team decided to investigate another option for the Opportunity Management System—developing the system internally. Once they knew how much it would cost to develop the system, they could perform the TVM and EVA calculations again to determine if they could provide a solution that added value to their shareholder investment—a solution that generated positive EVA.
References
Bloomburg. (2006). "Rates and bonds." Retrieved December 3, 2006, from http://www.bloomberg.com/markets/rates/.
CBU. (2006). "Glossary." Retrieved December 3, 2006, from http://www.cbu.edu/~lschmitt/I351/glossary.htm.
McClure, B. (2003). "All about EVA." Retrieved December 2, 2006, from http://www.investopedia.com/articles/fundamental/03/031203.asp.
Stewart, B. (2006). "About EVA." Retrieved December 3, 2006, from http://www.sternstewart.com/evaabout/whatis.php.
Tulley, S. (1996). "The key to creating wealth." Retrieved December 3, 2006, from http://www.sternstweart.com/publications/art_real_key.html.
Walker, D. F. (1999). "Cost justification of capital equipment using economic value added anlysis." Retrieved December 2, 2006, from http://www.nait.org/jit/Articles/walk0299.pdf.
No comments:
Post a Comment